
The Commit Partnership
Data Dashboard
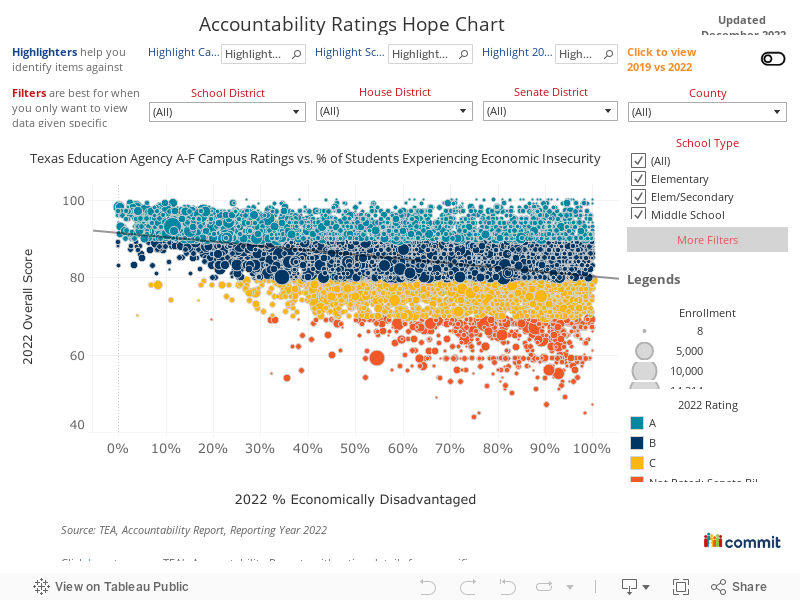
View campus level economically disadvantaged population % vs accountability overall score (Updated Jan 2023)
TEA Accountability Ratings Hope Chart
A "hope chart" demonstrates what's already possibly within our public education system by highlighting campuses and districts that are exceeding expectations in key academic benchmarks.
Didn’t find what you were looking for? Click HERE for related dashboards.
Still Have Questions?
Want to see more data?
Dashboard GalleryCan’t find data that you are looking for?
Data Request FormHaving trouble? Need help?
Contact CommitHave feedback?
Feedback FormHow were these numbers calculated?
Sources & Methodology