New Hope Chart: A–F Accountability Visualized


A new Commit hope chart brings our state’s A-F accountability system to life.
A "hope chart" is a category of data visualization that demonstrates what's possible within our public education system by highlighting campuses and districts that are exceeding expectations in key academic benchmarks. In this case, the benchmark used is a school’s A-F accountability rating.
Texas’ transparent accountability system empowers families, school leaders, and stakeholders with access to key data to understand academic performance through TEA’s A-F Accountability Rating. The system assigns each district and campus a score corresponding to a letter grade. The scores, required by House Bill 22 (2017), reward the better of absolute achievement or year-over-year growth and measure schools’ progress in closing achievement gaps (to learn more about the details of this system, see How Accountability Ratings Work).
This thoughtful formula is designed to give every district and campus a fair chance at success, where all schools can earn high marks. Critically, it also provides a means for apples-to-apples comparisons between schools. In a recent poll, 74% of North Texans said they supported the state’s current system of assigning an A-F letter grade for schools.
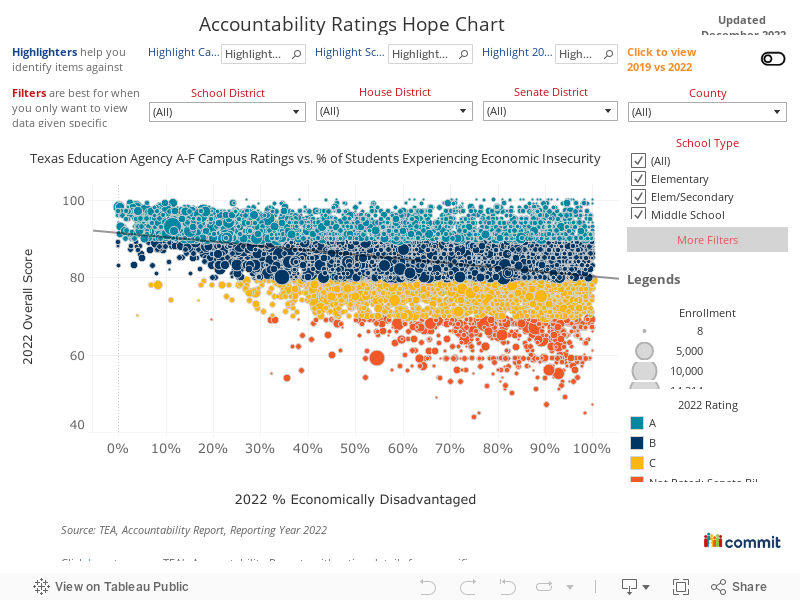
In our interactive dashboard, each public school campus in the state is represented by a dot, with the size of the dot corresponding to the campus’ enrollment. The vertical axis plots districts according to their A-F accountability score. The horizontal axis plots campuses by the percentage of their student body currently experiencing economic instability. This visualization can then be filtered by school district, legislative district, county, and more.
While the overall trend line does indicate a negative correlation between district achievement and student poverty, the slope of the line is small, indicating this correlation is weak. Moreover, every single dot above the trend line is a campus exceeding expectations and outperforming peers with similar poverty rates.
Even schools with high percentages of students experiencing economic instability are earning A’s. Most impressive are schools in the top right corner, like Farias Elementary in Laredo ISD and Premier High School of Mission, which approach 100% in both accountability rating and students experiencing economic instability. By visiting these campuses and learning from the best practices they employ, there is hope in how school leaders and state lawmakers can bring these success stories to scale across the entire state.
Latest Learnings


Be a part of the impact


.avif)