Data Drives Our Actions


Our data dashboards are designed to provide insights with the potential to increase economic mobility across Texas.


Since 2012, we’ve held ourselves accountable to our communities by reporting on the opportunity indicators that reveal the overall health of our region’s education and workforce pathways.
So, how are we doing?
As a result of coordinated community efforts, over 50,000 more students in Dallas County are meeting benchmark indicators since our inception in 2012.


What do you want to learn more about?
Families, communities, local leaders and statewide policymakers rely on data to make informed decisions and improve the experience of students. In Texas, we are fortunate that a great deal of information related to a child’s education trajectory is publicly available. Our data dashboards are designed to visualize large and complex datasets in easy-to-understand visualizations.
dashboardsPostsecondary
and living wageEarly childhood
educationTeacher and
educator dataSTAAR
performanceCampus and district
accountabilityLegislative
initiatives and dataEnrollment,
voters and demographicsCommunity and
statewide
Summary dashboards


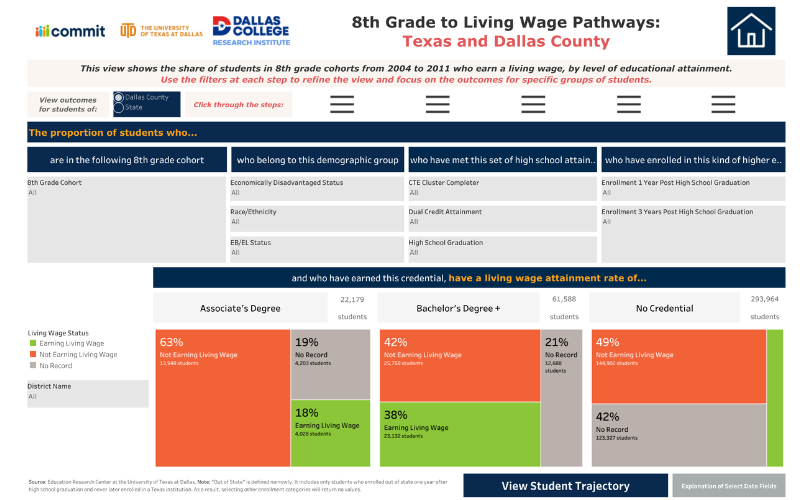
Postsecondary and living wage


%20Dashboard%20Thumbnail%20-%20Commit%20Partnership.jpg)
Early childhood education


Teacher and educator data


STAAR performance


Campus and district accountability


Legislative initiatives and data


Enrollment, voters and demographics


Still have data questions?
If you can’t find the data you need, are having trouble, want to offer feedback or find our how our numbers are calculated, we’re here for you.
Be a part of the impact


.avif)