Analysis by legislative district
Texas Legislative Districts: Student Demographics & TAPR Analysis
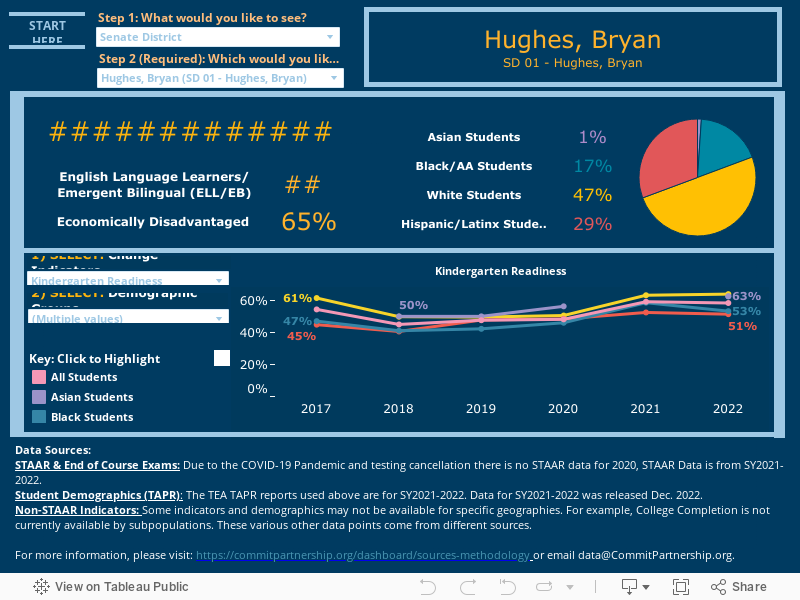
- Which Senate, House, and State Board of Education districts in Texas show disparities in educational attainment?
- What percentage of economically disadvantage students are meeting grade level standards in math and reading?
- What trends can be seen in the shifting demographics of the student population in my district?
This dashboard offers a look into Texas student populations by state and district. It also tracks progress on key indicators for various demographic groups since 2012.

%20(1).jpg)
share

Still have data questions?
If you can’t find the data you need, are having trouble, want to offer feedback or find our how our numbers are calculated, we’re here for you.
Be a part of the impact
Invest


.avif)