Summary dashboards
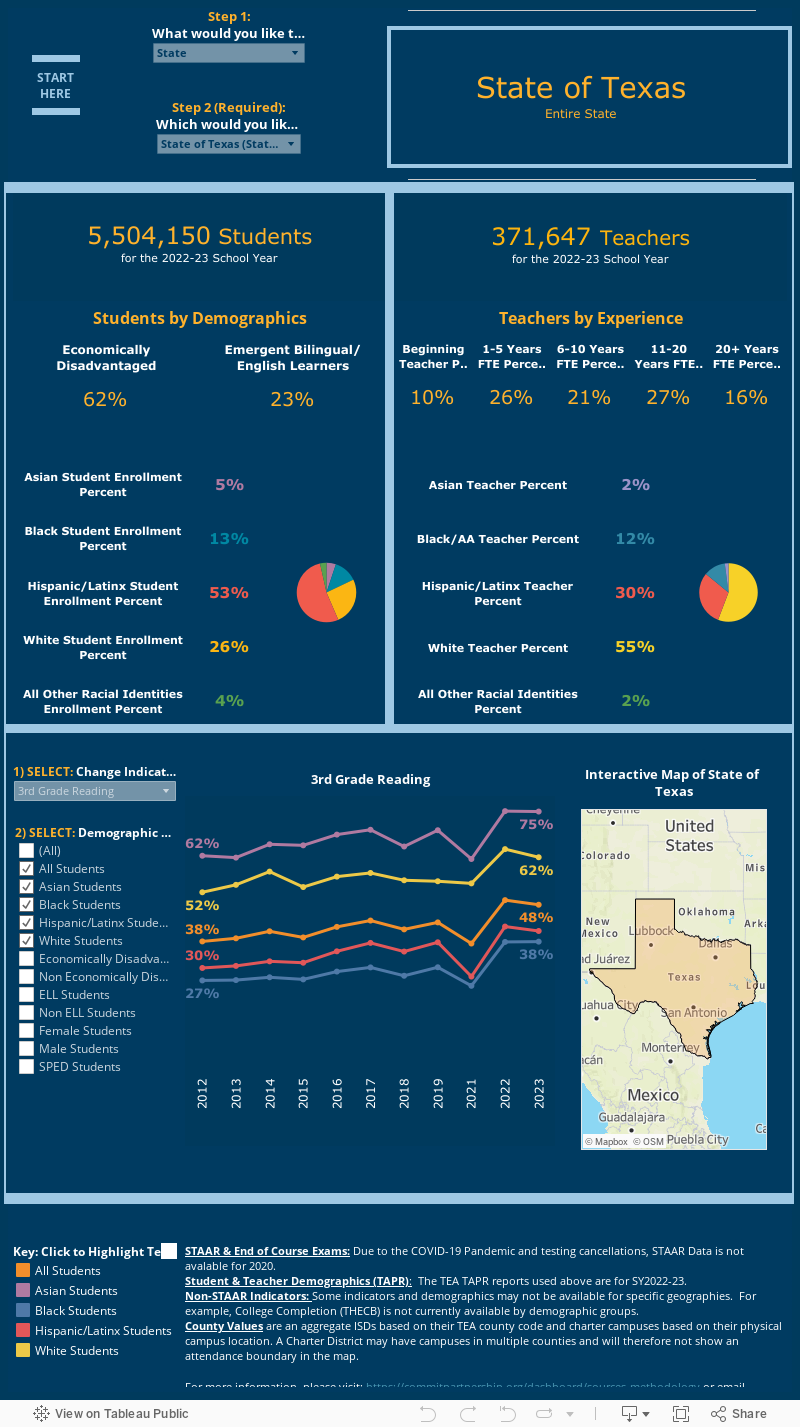
Explore Texas Student & Teacher Data by District and Region
- Which geographic regions in Texas show the most significant disparities in educational attainment?
- What percentage of economically disadvantaged students are meeting grade level standards in math and reading?
- What are the average years of experience for teachers in my district?
View education data about Texas’ student and teacher populations including demographics, experience levels, and test data over time.


share

Still have data questions?
If you can’t find the data you need, are having trouble, want to offer feedback or find our how our numbers are calculated, we’re here for you.
Be a part of the impact
Invest


.avif)