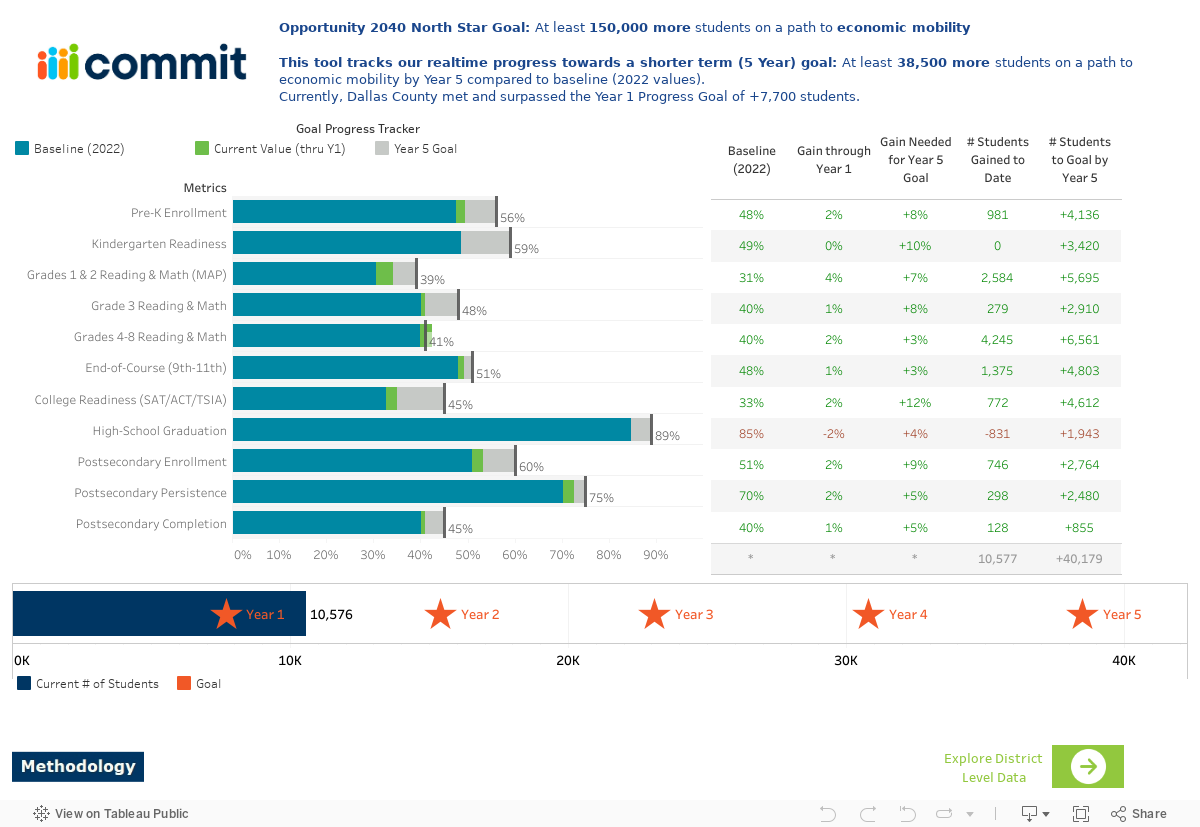
Opportunity 2040 Progress Tracker
- What is Opportunity 2040 and how does it impact my student or child?
- What key indicators are being tracked in the Opportunity 2040 Progress Tracker, and how do they relate to the overall goals of the initiative?
In 2022, the Commit Partnership and the Child Poverty Action Lab (CPAL) codified an 18-year community investment plan called Opportunity 2040, aimed at placing 150,000 more Dallas County students on a path to economic mobility while simultaneously reducing the number of children living in poverty by half. To measure progress toward this goal and students' advancement toward economic mobility and a earning living wage, key indicators will be tracked across the education continuum. These include pre-K enrollment, kindergarten readiness, academic performance in grades 3 through 8, high school graduation rates, and postsecondary enrollment and completion.


Still have data questions?
If you can’t find the data you need, are having trouble, want to offer feedback or find our how our numbers are calculated, we’re here for you.
Be a part of the impact


.avif)