
The Commit Partnership
Dashboard Gallery


Back to the Top
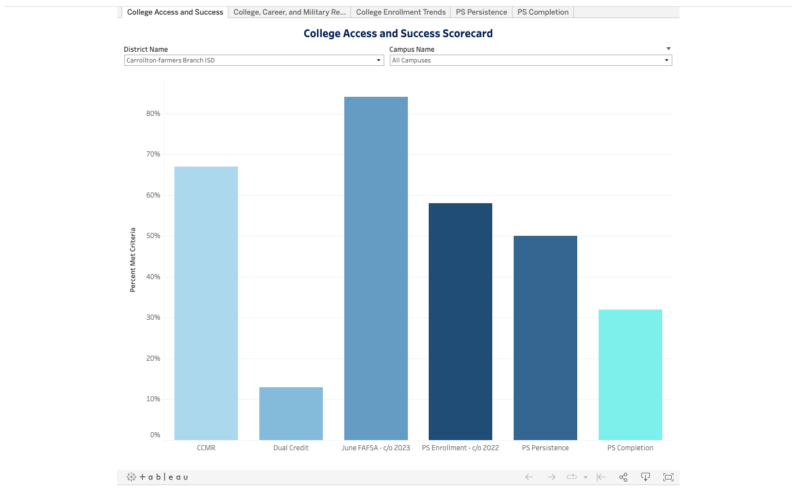
Postsecondary & Living Wage
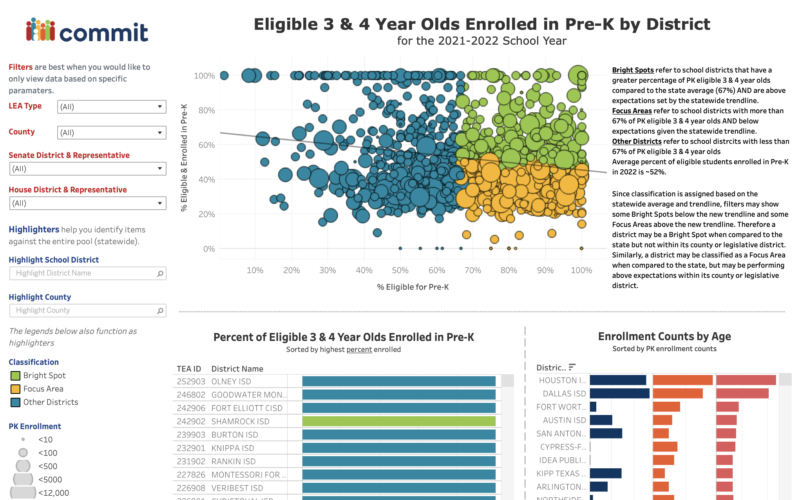
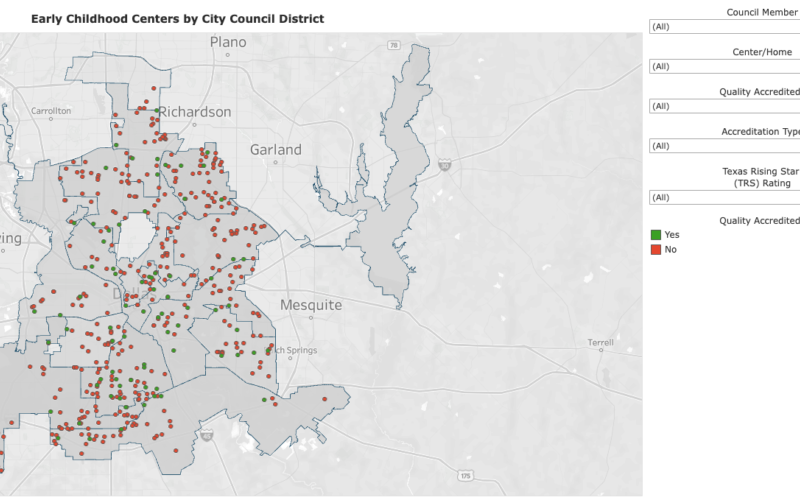
Early Childhood Education
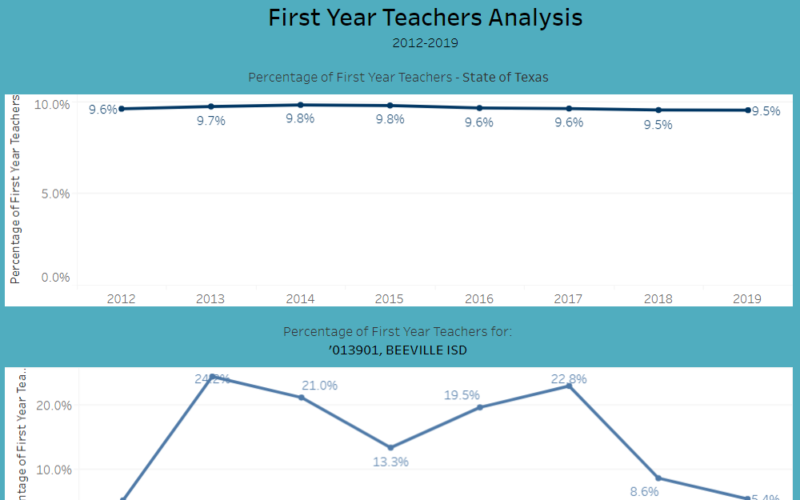
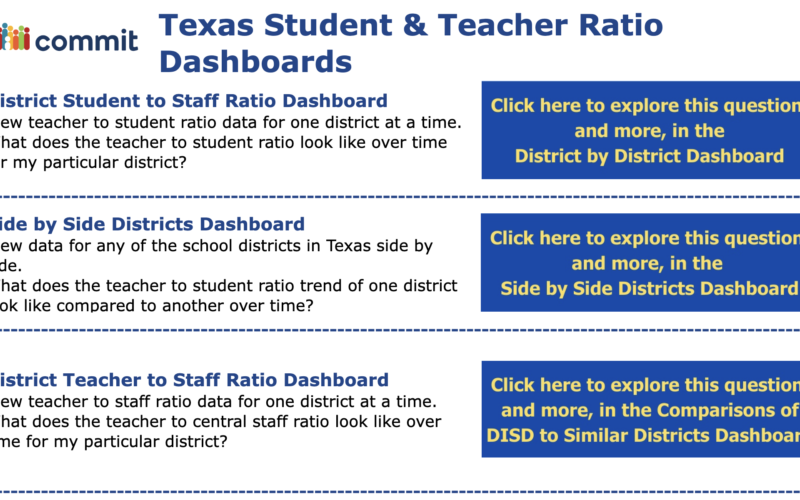
Teacher & Educator Data
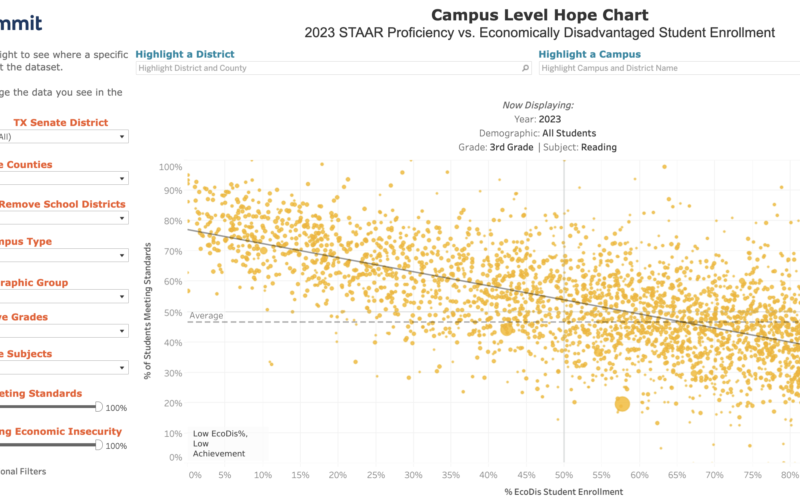
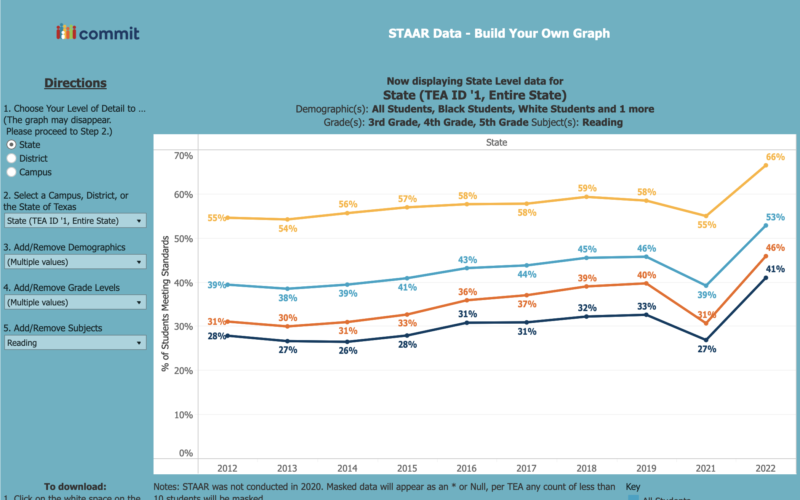
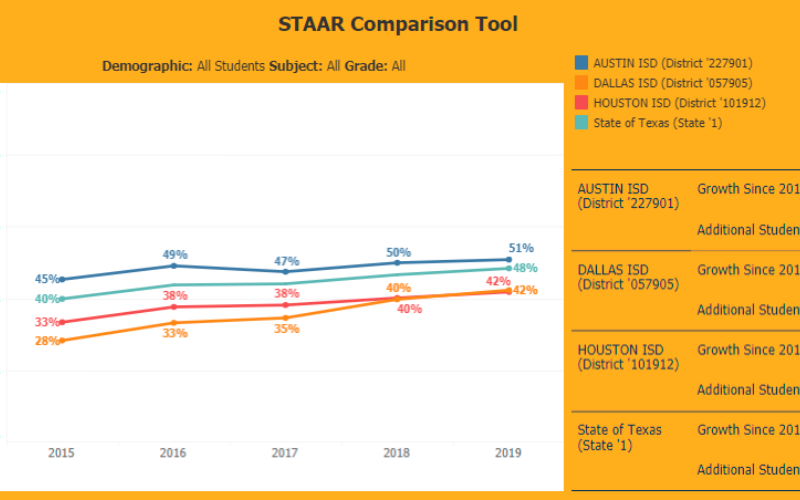
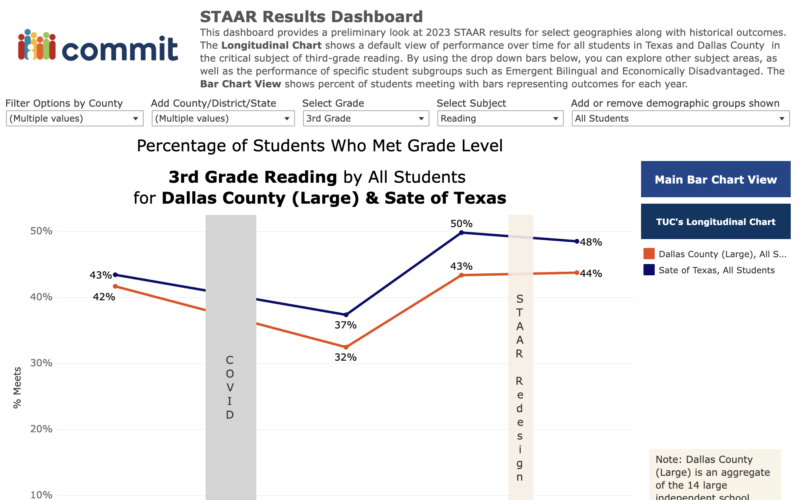
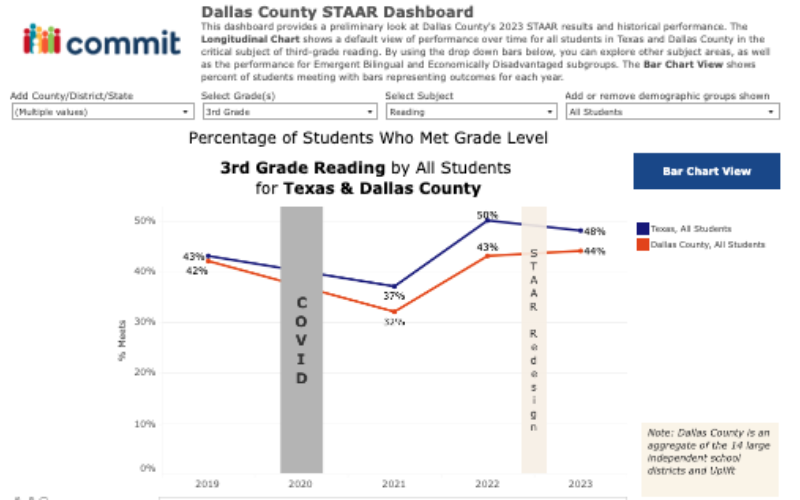
STAAR Performance
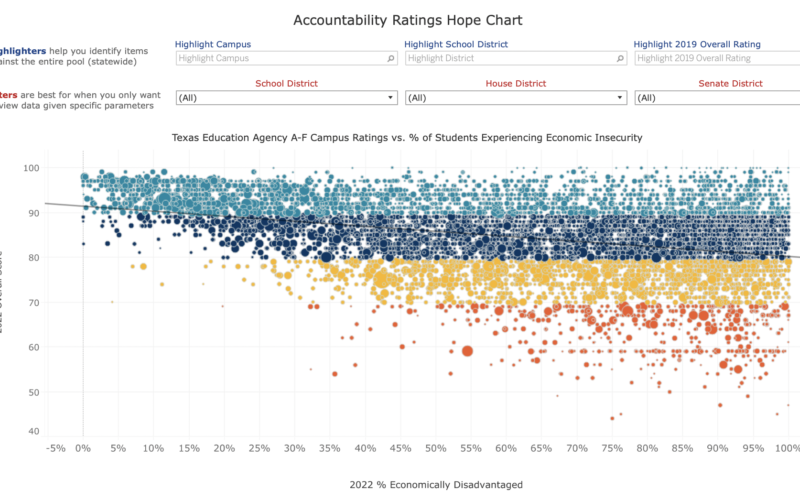
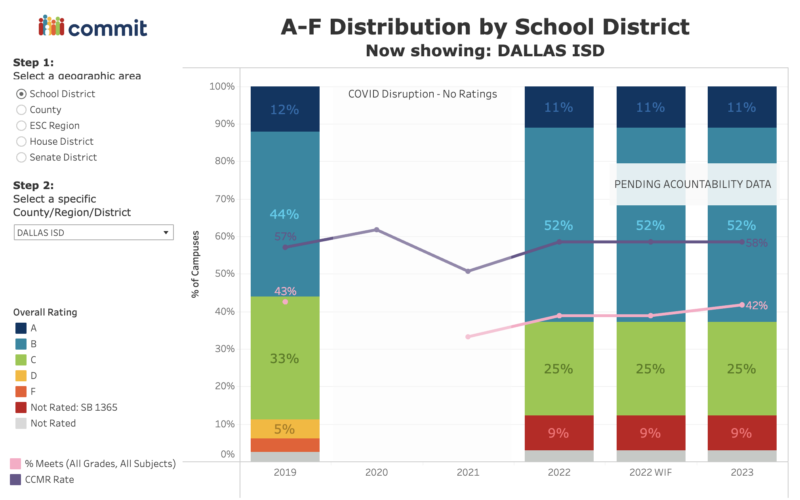
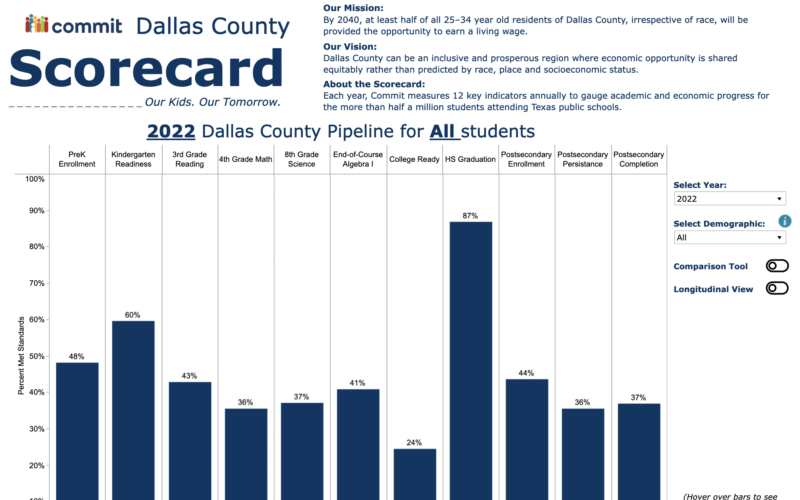
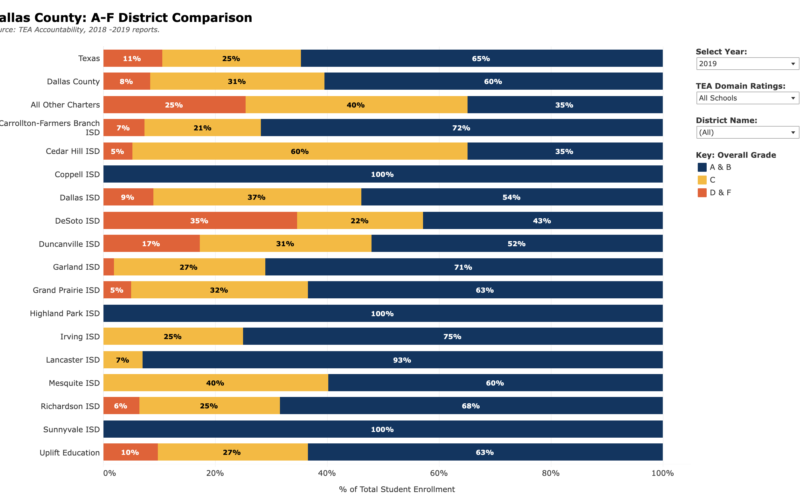
Campus & District Accountability
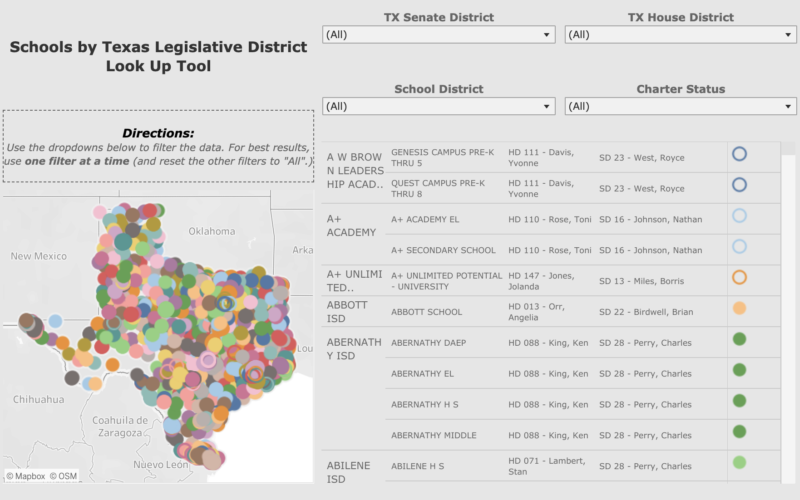
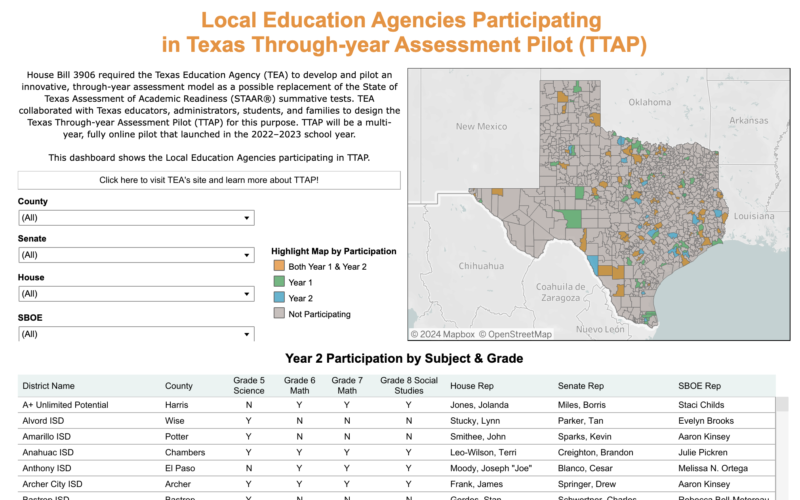
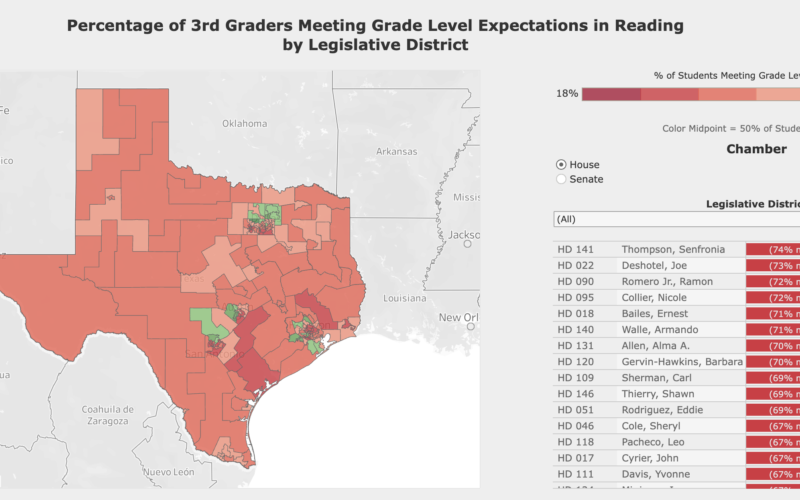
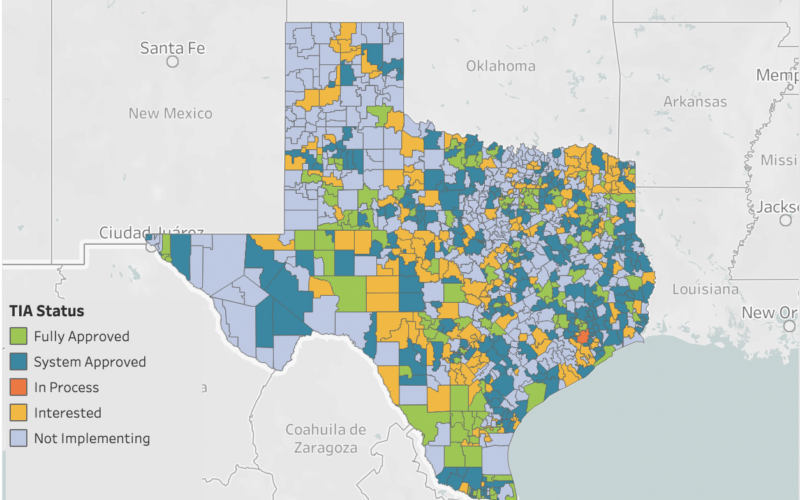
Legislative Initiatives & Data
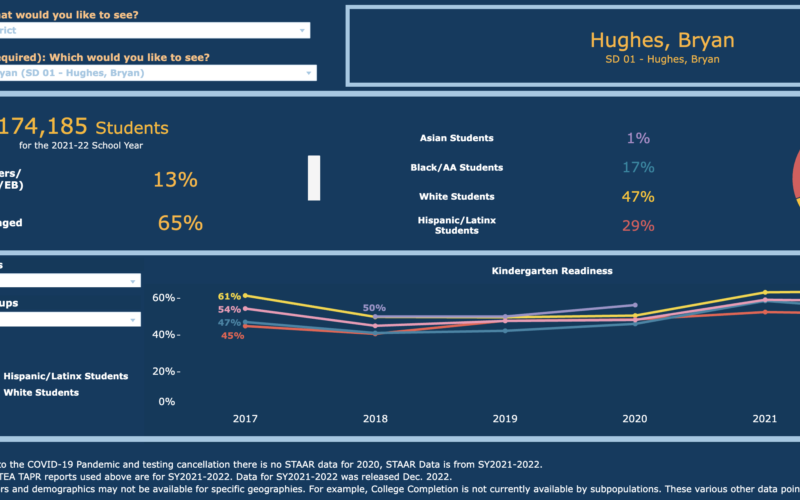
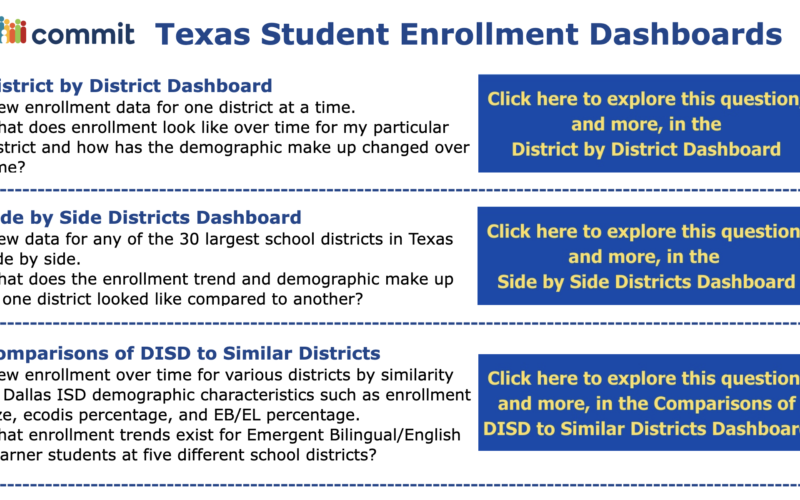
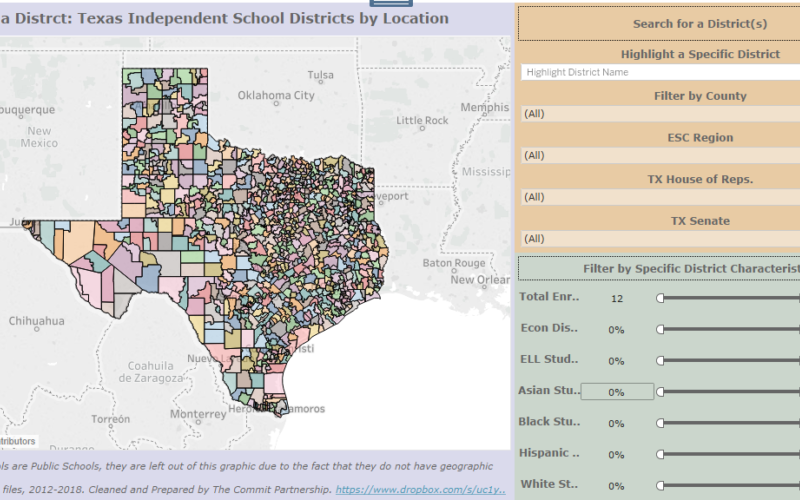
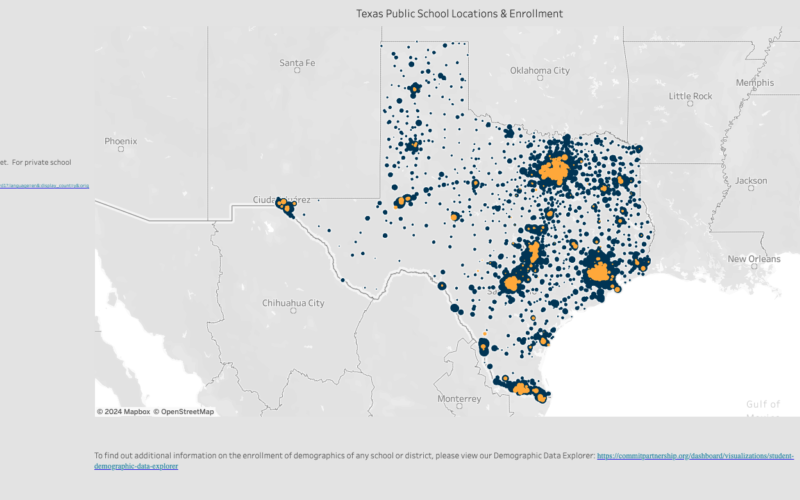
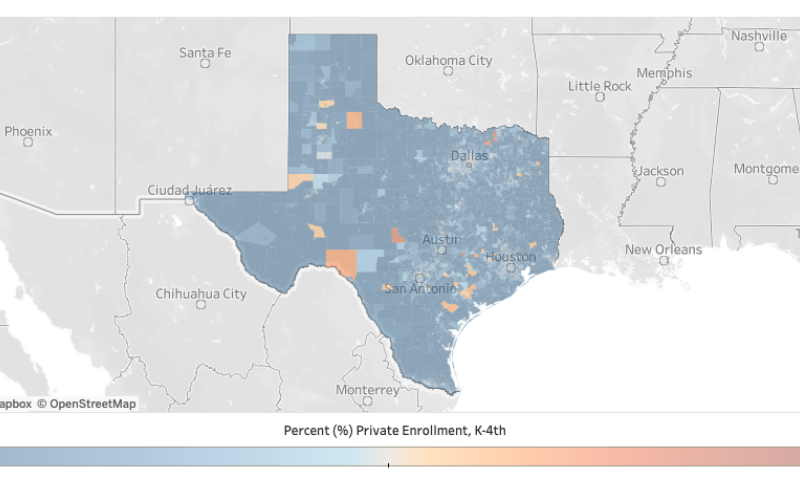
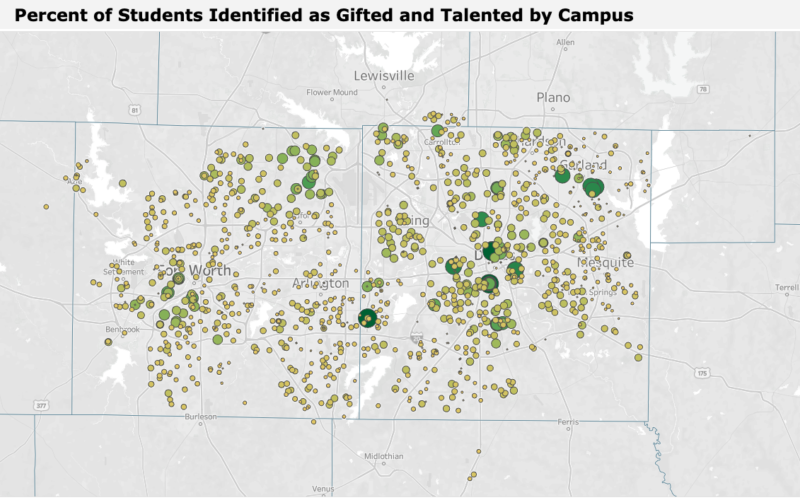
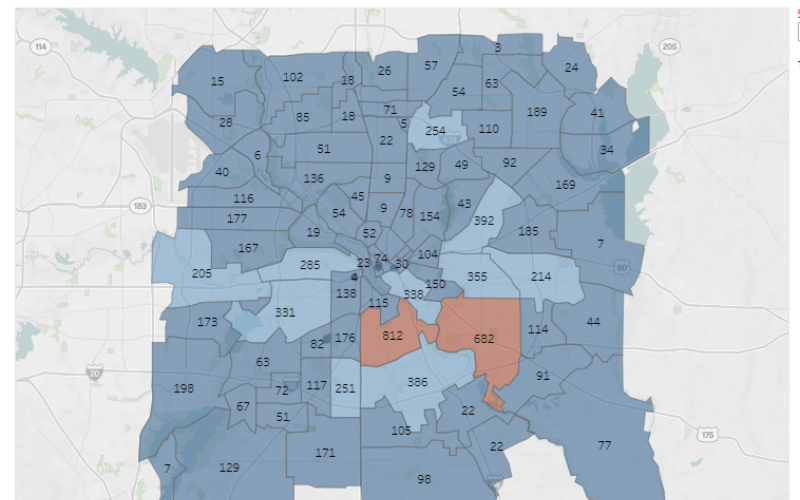
Enrollment, Voters & Demographics
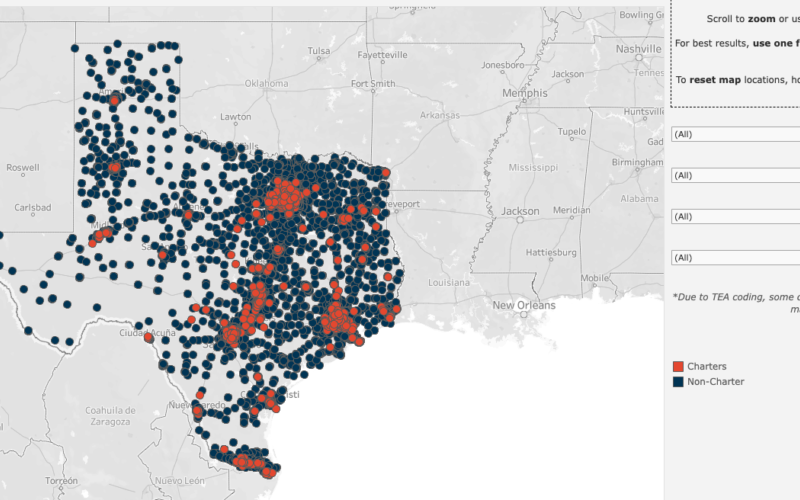
Dallas County & Districts
Community & Statewide
Still Have Questions?
Can’t find data that you are looking for?
Data Request FormHaving trouble? Need help?
Contact CommitHave feedback?
Feedback FormHow were these numbers calculated?
Sources & Methodology